

UPDATE 2: This page is not kept up to date and items may have changed. I will do my best, but even Google Earth as a whole has be changed significantly.
UPDATE: This page is featured in the ARRL Storm Spotting and Amateur Radio book. Including the cover image!
I wanted to find an easy way to integrate mapping, radar data, and APRS tracking data for SkyWARN events. I had been told to look at software from GRLevelX. Using a combination of pay software and add-ons, it appears possible. However, I wanted a way to do it for free. And I found it!
In this page, I am going describe the process I followed to:
- Getting a mapping program
- Show watch and warning data
- Show local and national radar data
- Show APRS tracking data
- All for FREE!
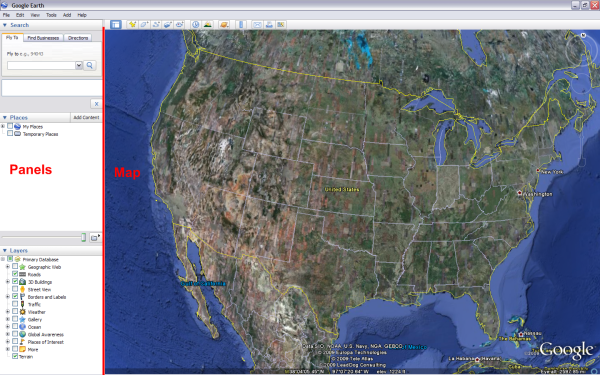
 To start, download and install the Google Earth program. Once installed, launch the program. When you launch the program, you will see the screen is divided into two sections. On the left is your working panels and on the right is the large viewing area. Your left panels are divided into three sections: Search, Places, and Layers. We will be using all three of these.
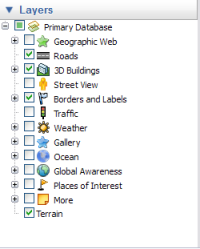 Once Google Earth is open, we want to set some basic settings. In the Layers panel, I recommend showing the following items.
- Roads
- 3D Buildings
- Borders and Labels
- Terrain
However, the choice is up to you to show more or less detail. Now the observant person may see an option for Weather right there. I do not like this option because they are pulling their data from Weather.com. They also only provide a national composite radar image. This means that Weather.com needs to grab the data from the National Weather Service (NWS) and stitch it all together into a national map image. This causes both a slight delay and a loss of some precision.
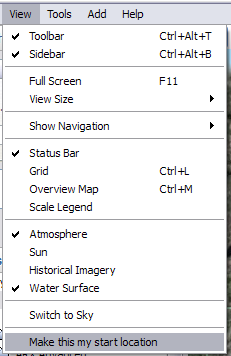 Now that we have the map showing the features we want, use the Search panel to get zoomed in on your county. I recommend adjusting the zoom to show your county and about one county more around it on all sides. This gives you a good view of what is coming your way. Once you have the zoom adjusted, click on the View menu and select “Make this my start location.” By doing this, Google Earth will automatically go to this view when the program is opened saving you the need to search for your location each time.
So at this point, we have met the first bullet of our requirements. But how can we get data directly from the NWS or APRS data into Google Earth? It is done through the magic known as Keyhole Markup Language (KML). KML is an extension of the eXtensible Markup Language (XML). KML allows for the overlay of images, data points, polygons, icons and links to inline rich-text data, HTML, or external websites. Often times KML files will be compressed or zipped into a KMZ file. Note to nerds: you can download a .KMZ file, rename it .ZIP, and extract the .KML file from it. You can then rename the .KML file to .XML and open it to see the raw data. Keep in mind that what you see may simply be a link to web data. We will see two examples of this as we go down our shopping list of wants.
Our next set of requirements requires data from the National Weather Service. All the data that we want to use is already provided. And now, the NWS provides this data via KML format! And to make it super easy, they created a KML/KMZ generator page that puts all items in one simple to use page.
UPDATE: Several of these KML generators have gone away. I recommend trying the following:
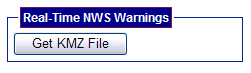
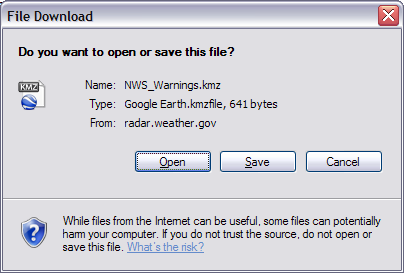
The second bullet is to see current watches and warnings. This is crucial to see what current hot spots exist. To add this data to Google Earth, go to the KMZ Generator page and click the “Get KMZ File” button for Real-Time NWS Warnings. Click the Open button when prompted. Google Earth will launch if it is not already open.
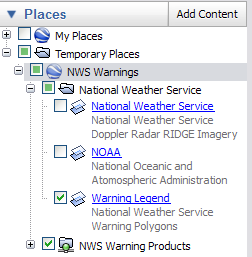
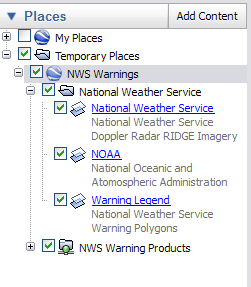 In the Temporary Places section of the Places panel, we see the NWS Warnings item is added. We expand this to see there are two items under NWS Warnings. The first is a folder called National Weather Service. Notice the standard folder icon showing this contains static information. Inside the National Weather Service folder are three items: National Weather Service, NOAA, and Warning Legend. The first two add logos to the screen while the third adds the warning legend: Red for Tornado, Yellow for Severe Thunderstorm, Green for Flash Flood, and Blue for Marine. I don’t particularly like parts of my screen getting covered by the NWS and NOAA logos. To get rid of them, you can simply right click on those items and select delete.
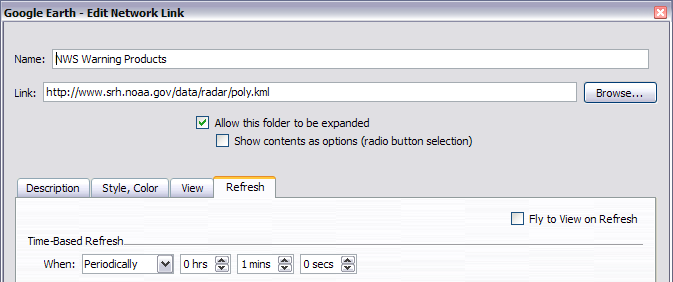
The second folder under NWS Warnings is a little different. You will notice this folder has a little network line under it. This tells us that the content of this folder is not static and is actually pulled from the web live. If we right click on the NWS Warning Products and select Properties, we can see what is really happening. Right on top, we see the link to http://www.srh.noaa.gov/data/radar/poly.kml. We start to see the nesting capabilities of KML. The initial KML file contained static items as well as this web link. Therefore every time we launch Google Earth, it will pull in the current information. Note to nerds: you can directly put this URL into your browser, save the .KML file, rename to .XML, and open it to see the raw data.
When we first selected this item, it was labeled “Real-Time.” We can review the refresh details for this network link. We can see here that it is set to pull new data every minute. So while it is labeled as real time, we are actually doing an update every minute. If you watch your screen closely and look at that network folder icon, you will see an animated folder icon as it is updating from the web. You will see “data” flowing over that little network line on the bottom of the folder.
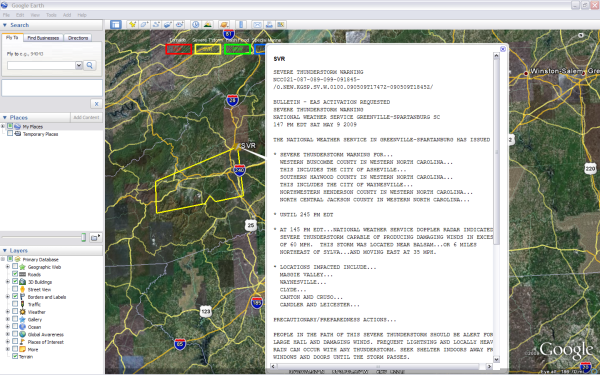
When we look at the map and see a warning, we can click on the little icon associated with the warning polygon. In this example, when I click on the yellow lightning bolt box on the upper right of the yellow warning area, I get a pop-up box right in Google Earth with the complete details of the warning, sightings, times, and locations.
Right now, our custom version of the NWS Warnings folder is stored in Temporary Places. As the name implies, when you close Google Earth, this will be lost. To save this, drag and drop the NWS Warnings folder from Temporary Places to My Places. Then click on the File menu, select Save, and Save My Places. Inside the My Places folder will also be your Starting Location saved from above. If you wanted to remove this, right click and delete it or just resave your starting location using the method above.
 At the front of each folder and item is a check box. When you check something at a higher level, all sub-levels and items will be checked. Therefore, if you did not want to delete those logos, you could simply uncheck them. However, for the ease of just being able to click the collapsed NWS Warnings folder and have all the contents selected and shown is great. If you want to see what each element does, use the individual check boxes to turn each item on and off.
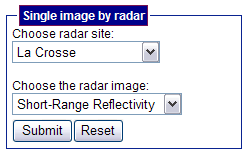
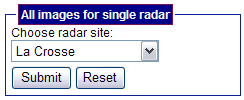
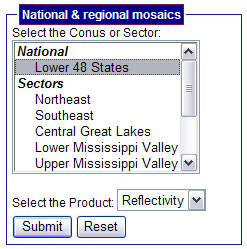
On to the next bullet: radar images. For my personal preferences, I actually wanted both local and national radar data. I find the local radar image has a little more detail than the national image. From the local radar site, NWS actually provides several types of radar images. Because of this, I actually create three different radar image items. For quick access, the first one I add is the Short-Range Reflectivity from the La Crosse site. Next, I add the All Images for the La Crosse site. This gives me a folder that contains each of the seven different images they offer. Finally, I add the Lower 48 States (CONUS) National mosaic reflectivity image.
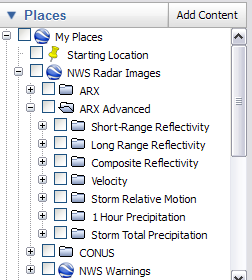
 As you may have seen before when you were deleting items, you can also rename them. So, after deleting unwanted elements, moving them from Temporary Places to My Places, reorganizing, and renaming, I get a structure that looks like the image to the right. This allows me to quickly select which items I want to see.
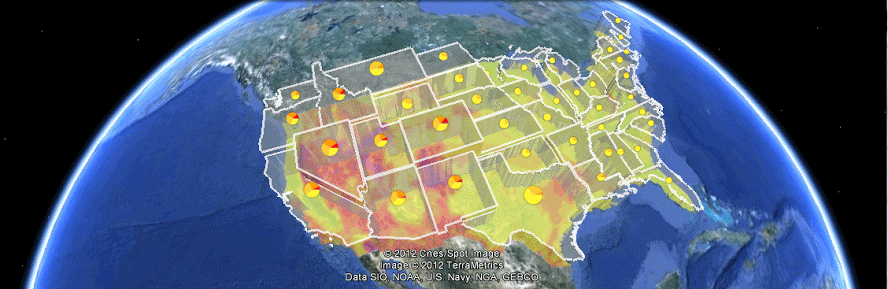
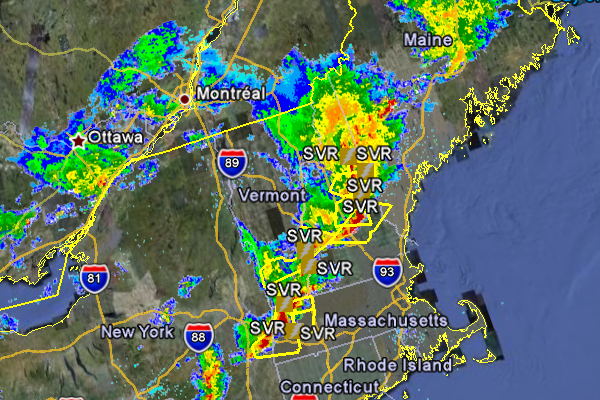
When I turn on the Continetal US data, I can see an overlay for the entire county and where any action is. Since the CONUS image requires building the image for the entire US, it will overlay with the local radar image. I recommend using only one or the other at a time, as they may not line up exactly over each other. At the time I am creating this document, there is no activity in the local region, so my La Crosse (ARX) radar images don’t show anything. However, in the Northeast, there is activity. Here is a sample of that part of the country showing the radar and warnings overlaid on the map.
So now we have a great map tool and have integrated all the weather data we want from the NWS. The next step is to add in the APRS data. Almost as easy as it was to add in the weather data, APRS.fi allows us to see the APRS data stream in KML form as well. Just go to APRS.fi and login with your call sign. There is no profile or account; you can put in anything you want. On the right hand side of the map, under Other Views, you will see a link for Google Earth. Just click that and hit open to bring APRS data into Google Earth.
When this item shows up in Temporary Places, it will load all the APRS locations for the past hour in the area of the map you are looking at. This will include station locations, paths, and weather data. Again, we can notice that this is a network folder, by its icon, and not static content. This means it is talking to APRS.fi to get the live data. It is actually smart enough to know what region of the map you are zoomed to. As you re-zoom or move around the map, it will trigger a refresh of the data and it will pull in the APRS data for your current view. It will also refresh every five minutes if the view does not change. Note to nerds: if you want to see how this works, right click and select Properties, as I showed above. Due to the large volumes of APRS data, it will limit it to 1,000 items on the screen. So if you pull out to show too large of area, such that greater than 1,000 items would need to be drawn, it will display only some of them. A message will show on the screen indicating that the number of items was limited and to zoom in to reduce the area to see all items.
 In addition to general APRS traffic from the past hour, you can track specific objects. After logging into APRS.fi, put the call sign and SSID (specific number for users that have multiple APRS devices) into the Track text box and hit search. This will show just that item on the APRS.fi map. However, now when you click the Google Earth link, in addition to the general APRS traffic folder for the last hour, you will get a second network folder for that particular call sign. It will show the last known location and path for that person, even if it was not during the past hour. If you have multiple calls you want to track, search for them on the site, add them to Google Earth, and move just those tracking folders from Temporary Places to My Places. As a reminder, don’t forget to save your My Places.
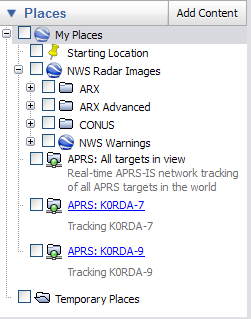
At the left you will see how I normally keep my personal My Places arranged. The Starting Location does not need to be checked. It will automatically set the map to that position. By checking that box, it will only add a “Starting Location” label to your map, which may get in the way of other data. I can quickly add in my local or national radar as well as watches and warnings. Finally, I have check boxes to add in all APRS data in my view as well as track my specific items.
So that completes the list of requirements! We now have a map program, with live data from the NWS showing both warnings and radar data. We have direct access to the details on those warnings. We can see both local and national radar. And we even integrated APRS data and paths onto our map. So what does this look like when all combined? Take a look at this sample.
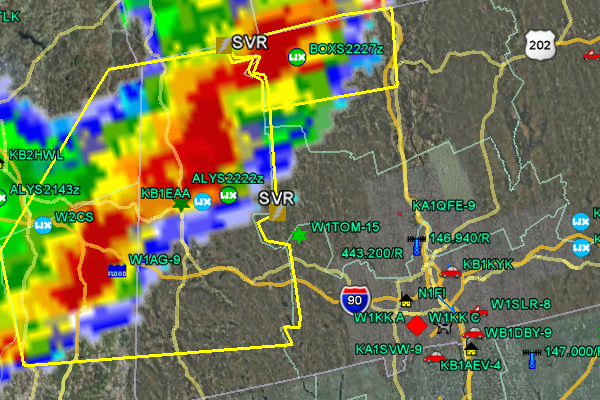
As you can see from this sample, having all this information together makes a very powerful tool for spotters or anyone at all. And don’t forget the best part: all of this is FREE!!!
UPDATE!!!
Since I created the original page above, the NWS has updated their loop capabilities. In the past, loops were hard coded to a specific time period. This means that when you added the loop, it worked for that time. However, if you came back a week later, the loop was coded to look at the original time one week ago. Now, the NWS has updated their loop code to always update in real time! This means that if I add a two hour radar loop to my list of places, when a new “frame” is added (every ten minutes), it will pick it up instantly. This means that your loop is never more than two hours ten minutes old! Plus, if you save, close, and reopen, it will pull in the current time’s loop. Depending on the loop you choose, it may be a one hour or two hour loop. The larger the coverage area, the shorter the loop and vice versa, smaller coverage areas give longer loops. The only thing they do not have that I would like to see is a full CONUS loop.
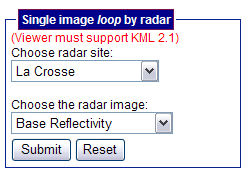
So how do you get these new loops? Just use the same KMZ Generator page to access the loop sections. For a single radar site, use the Single Image Loop section. For wider coverage, use the Regional Mosaic Loop section.
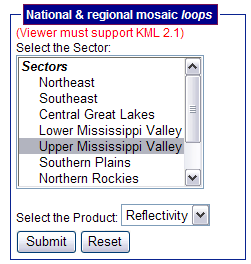
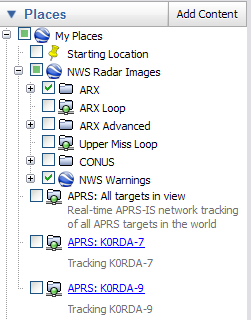 Because of these enhancements, I have added them into my standard saved locations. You can see in my new panel to the right I have everything I had above in addition to two loops. I have added in a single image loop for my closest radar site. This gives me a two hour loop. I also added the regional multi-radar site loop for me, the Upper Mississippi Valley. This gives me a one hour loop. Note to nerds: for those of you looking close, you can see how this new loop setup works. Take a close look at the folder icons for the loops. You can see that they have the data cable icon showing that they are network folders. This means they do not store any static info but are always pulling from the internet. I will leave it up to you if you want to explore the properties of these new folders using the methods described above.
Technical Reference Material: