1
Group Assessment Project
This section includes my group project. This project was made by Jenny Leonhardt and myself. This project includes several parts. The first is a class description. The second part is a pretest quiz that can assess the students before a unit. Included is a project that forces students to think outside the box and work on a real world problem. The next piece is a portfolio description and assessment sheet. The final item is an evaluation plan that pulls all of these pieces together to assess the whole student. This artifact includes the scoring rubric and all the above mentioned parts.
Class Description and Objectives
We will be teaching an Algebra I class. The students we will be teaching are in 10th, 11th , and 12th grade, except for the two gifted students who travel from middle school to take this particular math class. Our class will be a slightly diverse group. Our school is located in a suburban town. Our class will consist of 9 females and 15 males. Of these 24 students, 3 will be African American, 2 will be Asian, 3 will be Mexican, and the remaining 16 will be Caucasian. The children are primarily from a middle-class economic status. Of these 24 students, it was surveyed that 2/3 of the students are visual learners, and 5 are strong auditory learners. Three of our students are very active class participants. We plan to cover a lot of material this year. Our General Objective is that our students will understand the concept of lines and line formulas. To reach this objective, our students will have to do the following:
- define a line
- define slope
- calculate slopes
- write an equation of a line in point/slope form
- write an equation of a line in standard form
- reproduce the equation for finding the length of a line and it's midpoint
- calculate the length of a line
- calculate the midpoint of a line
- predict the characteristics of a line from a given equation.
Methods of Gathering Assessment Data
The ways that we will gather information about the students is to ask previous teachers for input, check the permanent records of the students, and most importantly, we will give a pretest covering all the material we are planning to teach throughout the year. These methods will give us a good background of our students. Throughout the year, we will give Benchmark tests that will cover the material covered throughout the year up to the time of the test. These tests will tell us how effective our teaching was. If the students are not performing up to the class standards, we will reteach the material in a new and fresh matter. We will use teacher generated assessment approaches and material that corresponds to what was taught. Finally, a cummutative final will be given to test what the students' have retained from throughout the year. These results can be used by the teachers of Algebra II and to give us insight about how well we taught our class and what should be done different in the following year.
Quiz
You have until the end of the class period to complete this test. You may not use your notes, texts, calculators, or other students. Show all your work, no matter how minimal. This test will be graded on effort, not necessarily correct answers. The grade for the quiz will be either Pass of Fail, depending on whether or not it was completed.
1. Solve for the variable.
a) 7x = 35
b) 3x + 2 = 9
c) x2 = 7
d) -x + 9 - 7 = 5 + 2
e) |y| = 6
f) |-y| = 10
2. Plot these points on the x and y axis.
- (5,2)
- (-7,7)
- (-2,4)
- (2 1/2, -6 1/2)
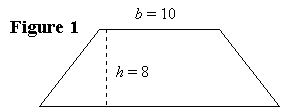
3. Find the area of a circle with the diameter of 6 units.
4. Find the area of a trapezoid. Use this equation:
1/2 h*(b+c)
5. Simplify.
a) (23) * (0.25) - (7) * (0.25)
b) 7 * (2c + 4d - 6)
c) 2x * (-11 + 11)
d) -3 + -3
e) -3 - -3
f) 3 - -3
6. Define
a) What is a line?
b) Write an equation for a line.
7. Define
a) What is slope?
b) Write the formula for slope.
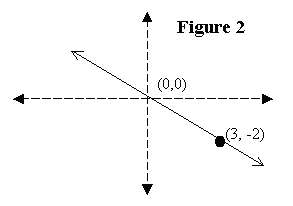
8. Calculate
a) Calculate the slope of the line in figure 2.
b) What is an equation for this line?
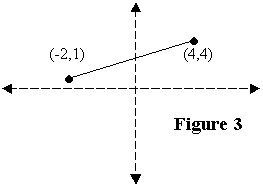
9. Complete
a) Write the formula for a length of a line segment.
b) Find the length of the line segment in figure 3.
c) Write the formula for the midpoint of a line segment.
d) Find the midpoint of the line segment in figure 3.
10. An equation for a line is y = 4/5 x +1.
a) What is the slope of this line?
b) What is the y intercept?
c) Sketch the line to the right.
Bridges to the Future
Directions:
You have been hired by the Bridges to the Future bridge building company
to calculate some of their construction needs. The bridge to get to the
school was blown apart by the recent high windstorm. The bridge needs to
be rebuilt as soon as possible to restore use of the road. To make sure
the bridge is not destroyed again, it must be reinforced at several
points. They need your information so that the proper amount of building
materials can be purchased. They have supplied you with the diagram
below, as well as all the information needed. This report is to be word
processed and presented in a professional report format, including a
cover letter with your names. In the report, you should include answers
to the following five pieces of information: the length of AB, the slope
of AB, the midpoint of AB (labeled M), the length of CM, and the slope of
CM. In addition to just the answers, include a discussion of how you
arrived at the answer. Furthermore, include an appendix showing all of
your calculations. The appendix may be hand written. Again, this report
is needed ASAP and your deadline has been set for Friday's class, next
week!
Information:
- Length of AD = 125 m.
- Length of CF = 75 m.
- Length of BC = 50 m.
- Triangle DEF is a mirror of triangle ABC
- BCFE is a rectangle

Bridge Project Assessment Rubric
Grade: /16
Completeness
4 All parts of the project are complete: all calculations are attempted,
work is
shown in an appendix. The report includes complete and thoughtful
explanations about each calculations asked for in the project
assignment.
3 Most of the parts of the project are complete: all calculations are
attempted, most work is shown in an appendix, the report is complete and
each explanation is clear.
2 Some of the part of the project are complete: all calculations are
attempted, some work is shown in an appendix, the report is nearly
complete and some explanation is attempted.
1 Little of the project is complete: some of the calculations are
attempted, no work is shown in an appendix, the report is not complete
and does not explain what was assigned.
Organization/Appearance
4 The project is typed, organized and professional-looking. It is also
creatively and neatly assembled.
3 The project is creatively and neatly assembled. Work is typed.
2 The project is typed. It lacks organization and is not neatly
assembled.
1 The project is not typed. It lacks organization and is not neatly
assembled.
Correctness
4 Calculations and explanations are correct.
3 There is/are one--two calculation or explanation error(s).
2 There are three calculation or explanation errors.
1 There are more than three calculation or explanation errors.
Conventions
4 The report contains no mechanical errors.
3 The report contains occasional mechanical errors.
2 The report contains many mechanical errors.
1 The report shows incorrect use of mechanics.
Grading Breakdown
A=15-16
B=13-14
C=11-12
D=10-9
Algebra I Portfolio
This portfolio will serve to demonstrate the knowledge and competency you possess. Your portfolio should include several items, listed below. Your portfolio should show that you understand the concepts of each section. Your portfolio should look professional.
Your portfolio should have the following categories:
- Chapters 1 to 12: You should include one or two items from each
chapter. Each item should have a small cover page with the date and why
you choose that item. The cover pages should be typed. These items
could include:
- Worksheets
- Quizzes
- Tests
- Group Work
- Projects
- Glossary of Terms: A list of definitions, in your own words, not copied from the book, which you have come across in the class. They should be typed. You should have at least 50 terms.
- Math Library: A list including general equations, their purpose, as well as sketches of them. They should be typed, but the sketches may be hand drawn. You should have at least 20 equations.
- Portfolio Project: For this section, you are to videotape yourself teaching and explaining a concept covered in the textbook. You should use some sort of visual aids (some examples are chalkboards or overheads). The videotape should be at least five minutes in length.
Rubric for Portfolio
Grade: /25
Descriptive cover page
3 All 12 chapters have cover pages which clearly explains why items were
chosen.
2 2-11 chapters have cover pages which contain sufficient explanations
why items where chosen.
1 1 or 0 chapters have cover pages in which explanations are unclear or
non- existent.
Included chapter items
4 Items chosen in each chapter demonstrate complete competency of
material.
3 Items chosen in each chapter shows appropriate evidence of competency
of material.
2 Items chosen in each chapter shows poor competency of skills.
1 Items were missing or not relevant to chapter.
Glossary of terms
4 Glossary contains a minimum of 50 terms, correctly and clearly
defined.
3 Glossary contains a minimum of 40 terms, mostly correct and clearly
defined.
2 Glossary contains a minimum of 30 terms, mostly correct.
1 Glossary contains less than 30 terms, little effort was made in
defining terms.
Math Library
4 Library contains a minimum of 20 items, includes equation, sketch, and
purpose for each.
3 Library contains a minimum of 15 items, includes equation , sketch, and
purpose for each.
2 Library contains a minimum of 10 items, includes equation and sketch or
purpose for each.
1 Library contains less than 10 items, shows little effort .
Portfolio Project
5 The student clearly and correctly explains concept. Student uses
appropriate and effective visual aids. The presentation is organized and
is a minimum of 5 minutes.
4 The student adequately explains concept. Students uses visual aids. The
presentation is organized and is a minimum of 4 minutes.
3 The student adequately explains concept. There is no use of visual
aids. The presentation is poorly organized. It is a minimum of 3
minutes.
2 The student poorly or incorrectly explains concept. There is no use of
visual aids. The presentation is poorly organized. It is a minimum of 2
minutes.
1 The student explains the concept poorly and incorrectly. There is no
use of visual aids. There is little or no organization. It is less than
two minutes.
Appearance/Organization of Portfolio
5 The portfolio is neatly bonded together (video can be separate). The
material which is supposed to be typed, is. The portfolio includes a
professional cover page. The material is placed in a logical order and is
neatly organized.
4 The portfolio is neatly bonded together (video can be separate). The
material which is supposed to be typed, is. The portfolio is sufficiently
organized, and includes a cover page.
3 The portfolio is sufficiently organized. There is no cover page. The
material which is supposed to be typed, is.
2 The portfolio is organized and bonded poorly. There is no cover page.
Some of the material which is supposed to be typed, is.
1 Little or no effort in this category is shown.
Grading Breakdown
A=25-23
B=22-20
C=17-19
D=14-16
Evaluation Plan
Our evaluation plan is twofold. The first part is to use a numerical average of the grades of the assignments in class. These individual grades will also be given to the students when the original work is returned to the students. The breakdown of the percentages and their letter grade equivalents are given on the attached grading chart. This will also fulfill any requirements that the school has in regards to a letter grade for the class. These report cards will provide feedback to students and their parents.
The second section of our evaluation plan involves a competency checklist we developed. This checklist provides the students and parents information about the competencies that the student possesses. The checklist is required to be discussed with the parents. After discussion, the parent can provide feedback to the teacher.
By using these two methods of summative evaluation, we feel that students and their parents will get a complete picture of their performance. The report card letter grade serves as a holistic assessment while the competency checklist provides an analytical assessment. We feel that these two combined will work for the best interests of most students.
Grading Chart
Your grade will be composed of the following weighted average:
- 30 % Major Exams including Final
- 20 % Reports and Projects
- 20 % Portfolio
- 15 % Classroom Quizzes
- 15 % Homework
Letter Grades
- 93 - 100 A
- 90 - 92 A -
- 88 - 89 B +
- 83 - 87 B
- 80 - 82 B -
- 78 - 79 C +
- 73 - 77 C
- 70 - 72 C -
- 68 - 69 D +
- 63 - 67 D
- Below 63 F
Competency Checklist for Student Mastery of Objectives
Line Unit
This chart provides a summarized evaluation for the benefit of both the student and the parents. This checklist is filled-out by the teacher based on evidence of work submitted throughout the unit. This checklist is to be discussed by both the parents and the student, after which parents are urged to provide written feedback to the teacher. After feedback is given, both parents and student are to sign and date where space is given. Thank you.
Scale
- secure = 4
- developing = 3
- needs further developing = 2
- not present = 1
The student expresses competency at the following level:
___ define a line
___ define slope
___ calculate slope
___ write an equation of a line in point/slope form
___ write an equation of a line in standard form
___ reproduce the equation for finding the length of a line and its
midpoint
___ calculate the length of a line
___ calculate the midpoint of a line
___ predict the characteristics of a line from a given equation
Parent's Feedback:
Student's Signature:
Parent's Signature:
© Copyright
Robert Andrews
All pages, scripts, and graphics.